Auckland economic update April 2026
Author:
Ross WilsonSource:
Auckland Council Social and Economic Research and Evaluation TeamPublication date:
2026Topics:
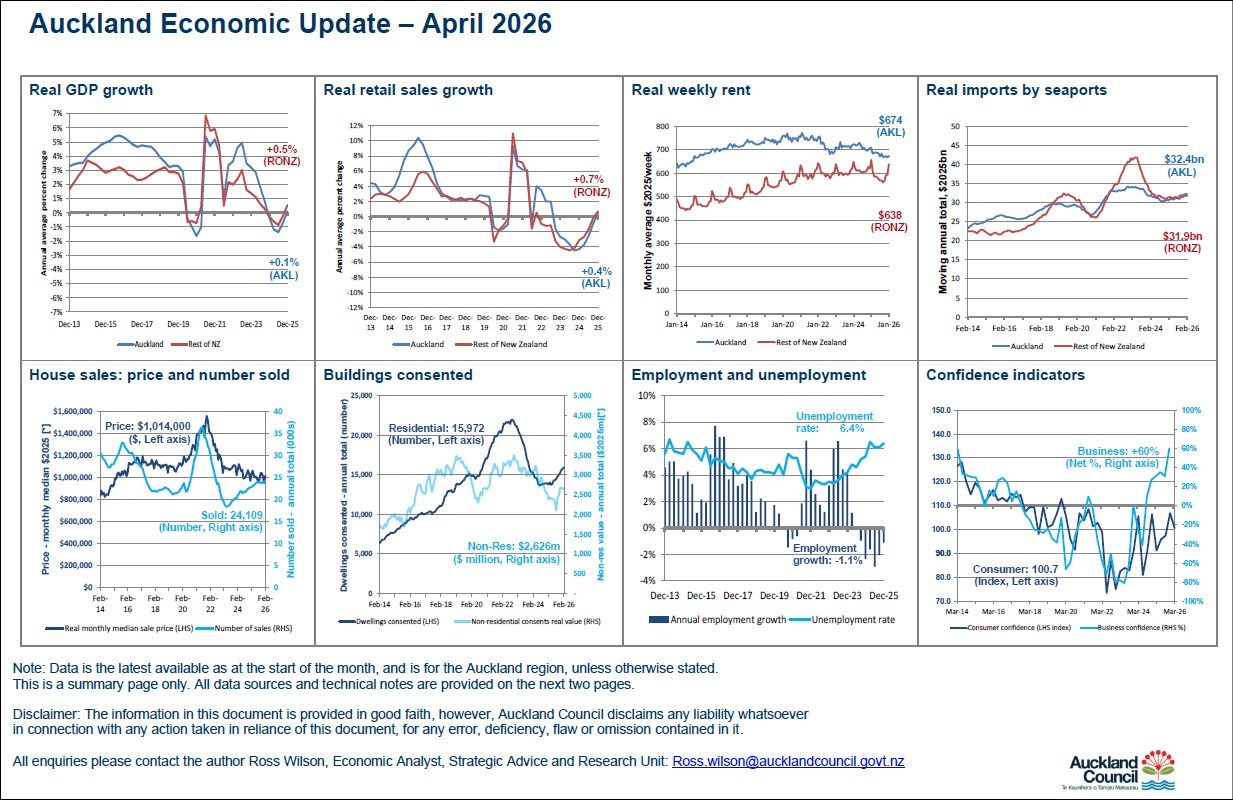
EconomyAn overview of the Auckland economy for April 2026, in charts and graphs and with some commentary.
Measures covered are: house prices and numbers sold, weekly rents, building consents, employment and unemployment, GDP, business and consumer confidence, retail sales, imports.
Highlights include:
- consumer confidence index for the March 2026 quarter was 100.7: reversing last quarter’s peak; above most of 2022-2025; below 2009-2017;
- median house price for the month of February 2026 was $1,014,000 (in real* dollars: 6% above last month; 2% below a year ago; 35% below the 2021 record peak; 3% below ten years ago);
- number of houses sold for the year ended February 2026 was 24,109: fairly flat since July 2025; 32% above the May 2023 trough; 34% below the 2021 peak; a little above mid-2017 to mid-2020;
- average weekly rent for the month of January 2026 was $674 (in real* dollars: similar to the last six months; 13% below February 2021; same as eleven years ago). For the rest of New Zealand, the figure was $638: the highest since January 2025 (but highly seasonal); 3% below a year ago; the lowest-equal January figure since 2020;
- number of new dwellings consented in the year ended February 2026 was 15,972: rising steadily since April; 16% above a year ago; 27% below the September 2022 peak; 5% above the 2019 pre-Covid peak;
- real* value of new non-residential buildings consented in the year ended February 2026 was $2,626 million: flat for the last three months; 25% above August’s trough; 11% above a year ago; 25% below 2022 and 2019 peaks; 14% above the 2020 trough;
- real* value of imports by Auckland seaports for the year ended February 2026 was $32.4 billion: steadily rising 7% over the last 15 months, still 5% below April 2023, but 21% higher than the 2020 Covid trough. For the rest of New Zealand, the figure was $31.9 billion: mostly slightly above the last two years, 22% above the 2020 trough, and 24% lower than their 2023 post-Covid rebound peak.
*Note: real dollars/values are after adjusting for the effects of inflation each quarter, so a similar ‘real’ level means that a value rose at a similar rate to inflation.
April 2026
Previous updates.
2025