Auckland economic update June 2026
Author:
Ross WilsonSource:
Auckland Council Social and Economic Research and Evaluation TeamPublication date:
2026Topics:
EconomyAn overview of the Auckland economy for June 2026, in charts and graphs and with some commentary.
Measures covered are: house prices and numbers sold, weekly rents, building consents, employment and unemployment, GDP, business and consumer confidence, retail sales, imports.
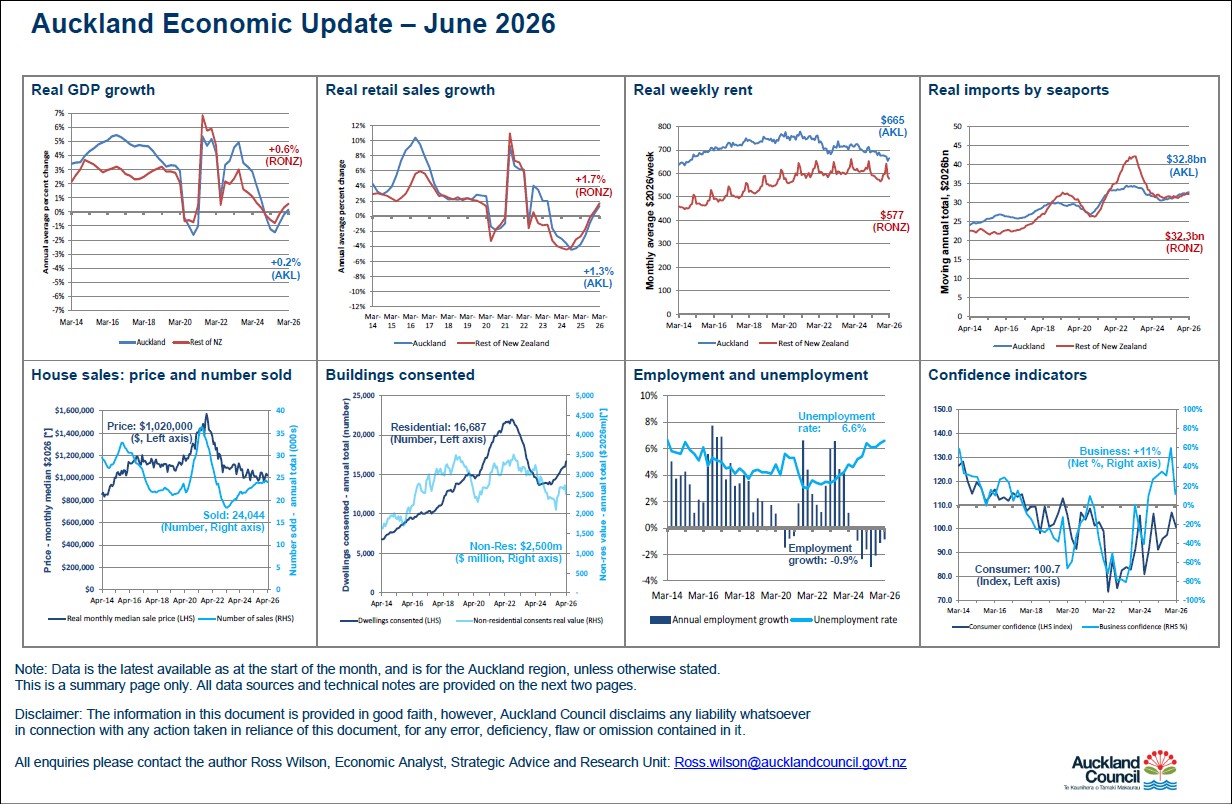
Highlights include:
- real* GDP for the year ended March 2026 was 0.2% higher than for the year ended March 2025; in the rest of New Zealand, the annual change was 0.6% rise. Both growth rates: continued the improvements since June; were still barely positive yet; were below most of 2010 to 2024; were a little above their 2020 (Covid) troughs
- real* retail sales for the year ended March 2026 were 1.3% higher than for the year ended March 2025; in the rest of New Zealand, the annual change was a 1.7% rise. Both growth rates continued the improvements of the last eighteen months, in contrast to the falls from 2021 to 2024. They are still quite modest despite population increases, so not yet returned to the pre-Covid levels of at least 2%;
- employment for the March 2026 quarter was 0.9% lower than in March 2025 quarter: the seventh quarter in a row of negative annual growth; the fourth quarter in a row of less negativity; but among the worst since 2009-2010 (post-GFC);
- unemployment rate for the March 2026 quarter was 6.6%: mostly rising since 2023; double the 2021 trough; the highest since 2014; similar to most of 2011 to 2015; only 1.5% below the 2010 peak (8.1%);
- median house price for the month of April 2026 was $1,020,000 (in real* dollars: 2% below last month; same as a year ago; slight downtrend the last three years; 35% below the 2021 peak; similar to eleven years ago);
- number of houses sold for the year ended April 2026 was 24,044: fairly flat since June 2025; rising 31% since the May 2023 trough; 34% below the 2021 peak; above mid-2017 to mid-2020;
- average weekly rent for the month of March 2026 was $665 (in real* dollars: trending down since mid-2024; 15% below February 2021; second lowest in eleven years). For the rest of New Zealand, the figure was $577: 2% lower than February 2026 (but highly seasonal); 4% below a year ago; falling since 2024; the lowest March rent in six years;
- number of new dwellings consented in the year ended April 2026 was 16,687: 4% above March, and rising steadily by 21% in a year; 24% below the September 2022 peak; 10% above 2019’s pre-Covid trough;
- real* value of new non-residential buildings consented in the year ended April 2026 was $2,500 million: 8% below March; 19% above August’s trough; 4% above a year ago; 29% below 2022 and 2019 peaks; 8% above the 2020 trough;
- real* value of imports by Auckland seaports for the year ended April 2026 was $32.8 billion: slowly rising 7% since October 2024, still 5% below April 2023, but 22% higher than the 2020 Covid trough. For the rest of New Zealand, the figure was $32.3 billion: flat for the last four months. Auckland has mostly been half the New Zealand total since 2018; before then it was mostly more than half.
*Note: real dollars/values are after adjusting for the effects of inflation each quarter, so a similar ‘real’ level means that a value rose at a similar rate to inflation.
June 2026
Previous updates.
2025